Logistics KPI Dashboard Excel Template
Are you responsible for measuring key performance indicators for logistics and supply chain operations in your organization? This Logistics KPI Dashboard Excel Template is your essential companion for tracking, analyzing, and improving logistics performance. What Is Logistics? Logistics is the strategic management of the flow of goods, services, and information from the point of origin


 2 Files
 56 Purchases
 Unlimited access, anywhere, anytime
 Upgrade to Student or Pro plan to avail more discounts and perks
Files
- Logistics KPI Dashboard- Final1.65 MB
- Logistics KPIs Definitions221.52 KB
What Is Logistics?
Logistics is the strategic management of the flow of goods, services, and information from the point of origin to the point of consumption. It covers procurement, inventory management, warehousing, transportation, and distribution. Effective logistics ensures timely deliveries, minimizes costs, and optimizes supply chain operations — ultimately improving customer satisfaction and business performance.What Is a Logistics KPI Dashboard?
A Logistics KPI Dashboard is a visual tool that provides a real-time overview of key logistics metrics. It tracks KPIs such as:- Order fulfillment rates
- On-time delivery performance
- Inventory turnover ratios
- Transportation and warehousing costs
Why Are Logistics KPIs Important?
Logistics KPIs and metrics matter because they enable businesses to:- Make informed decisions: Spot bottlenecks and optimize resource allocation.
- Improve efficiency: Reduce costs, streamline workflows, and boost productivity.
- Enhance customer satisfaction: Deliver orders on time and resolve issues quickly.
- Gain a competitive advantage: Achieve faster time-to-market and stronger service levels.
Six Focus Areas in the Logistics KPI Dashboard
Our Dashboard presents metrics across six critical performance areas:- Time
- Quality
- Cost
- Productivity
- Safety
- Culture-related KPIs
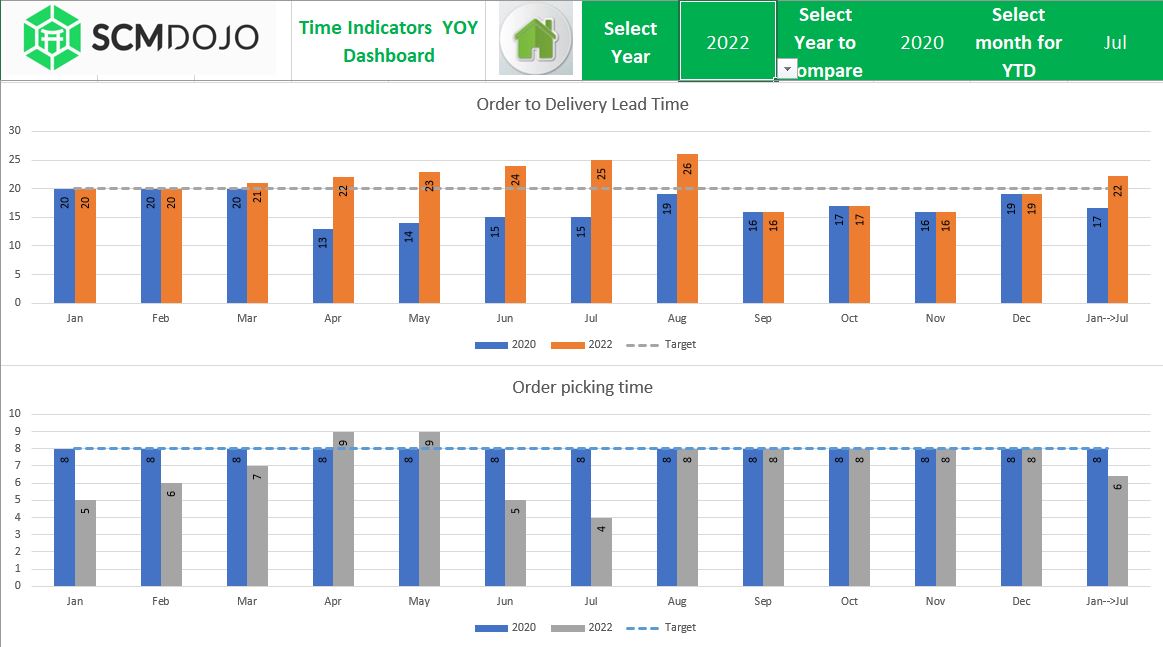
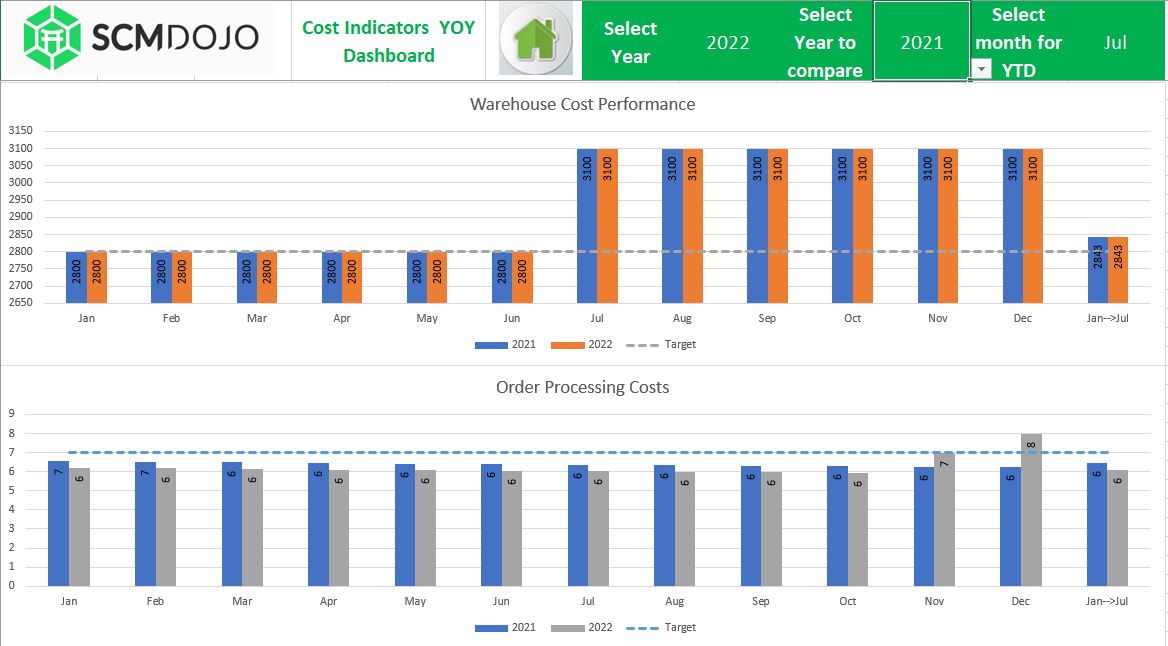
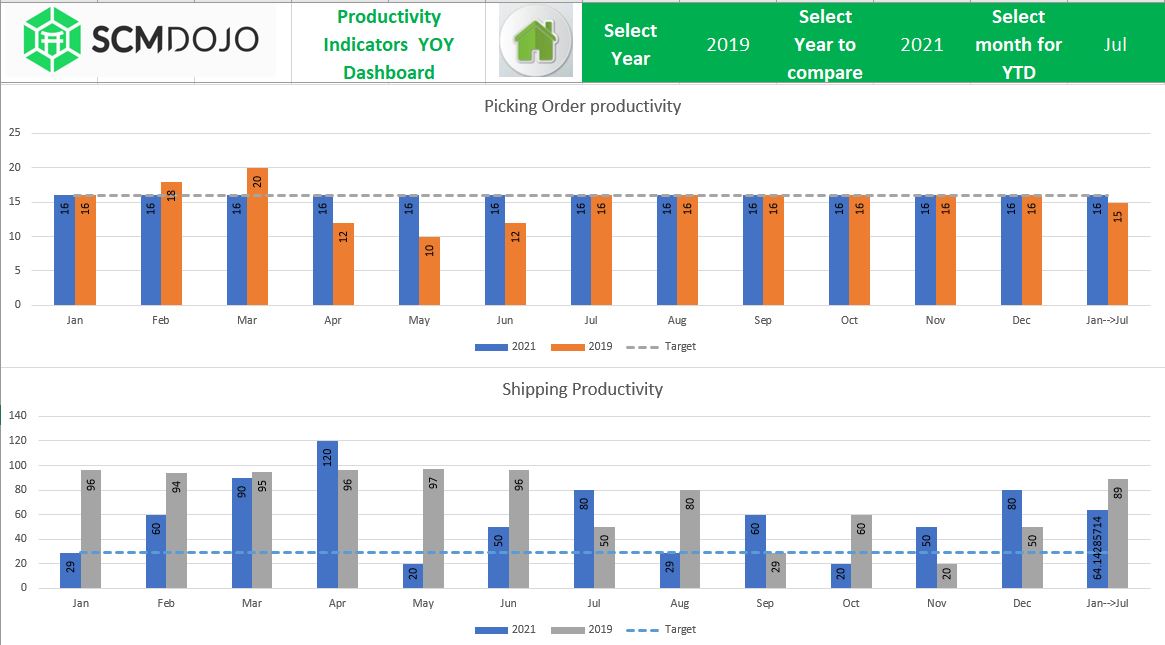
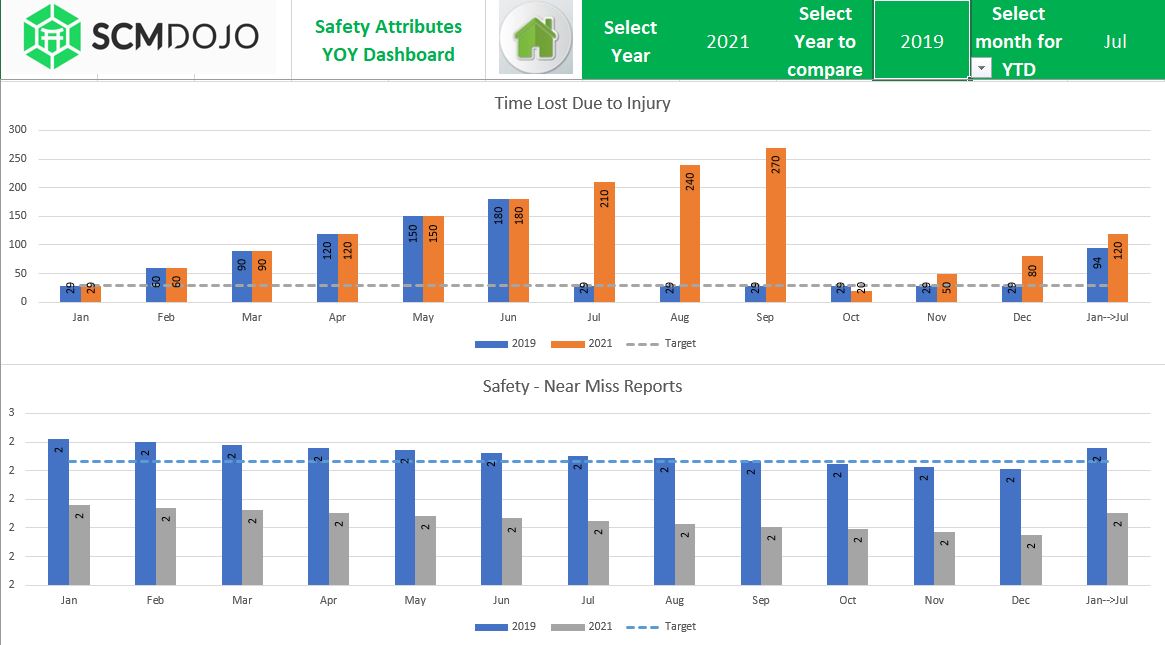
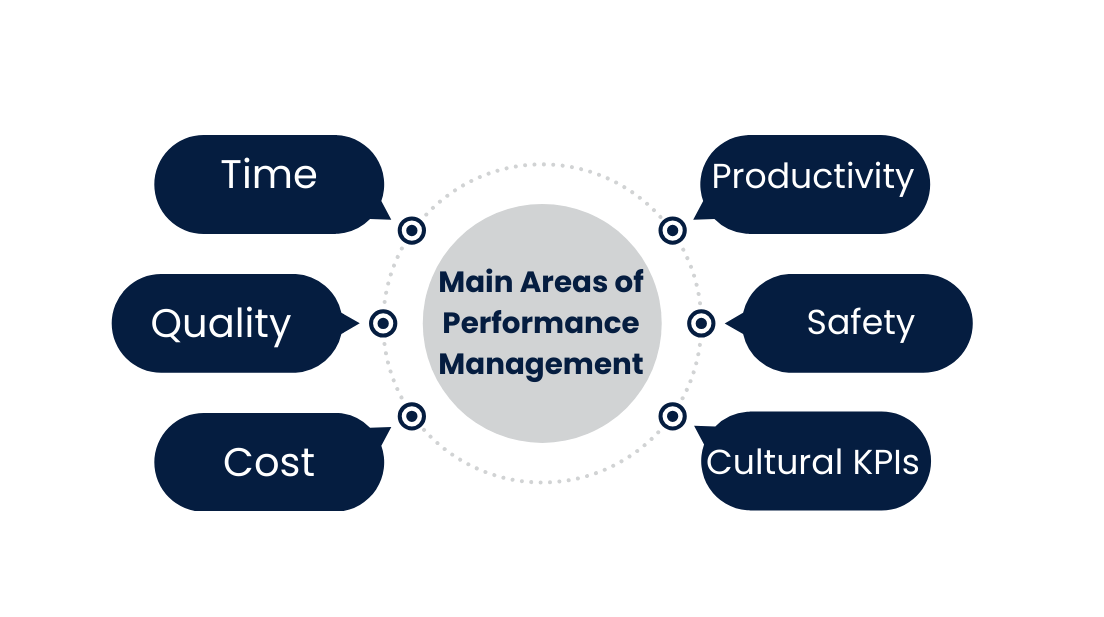 The Logistics KPI Dashboard tracks six critical areas of performance management: Time, Quality, Cost, Productivity, Safety, and Cultural KPIs.
Key Features of the Logistics KPI Dashboard Template
Unlock the power of KPI tracking with these benefits:- Easy Performance Tracking: Monitor logistics KPIs with accurate data in one place.
- Save Time: Automates reporting, saving 6–8 days of dashboard production per cycle.
- Best Practice Framework: Built on industry-standard logistics and supply chain KPIs.
- Performance Comparison: Measure current performance vs. targets and historical data.
- Identify Trends: Spot patterns in operations to support strategic planning.
- Comprehensive Oversight: Ideal for supply chain and logistics managers.
- Ready-to-Use: Hassle-free setup for immediate use.
- Fully Customizable: Tailor metrics to your business needs and industry focus.
Recommended Logistics KPIs
To support your business, we’ve identified 47 recommended Logistics KPIs for you to choose the most relevant ones. The dashboard also includes 25 frequently used KPIs in the manufacturing and distribution industry, ready to use right out of the box. These KPIs cover:- Time indicators
- Cost indicators
- Quality metrics
- Productivity performance
- Safety attributes
- Cultural KPIs
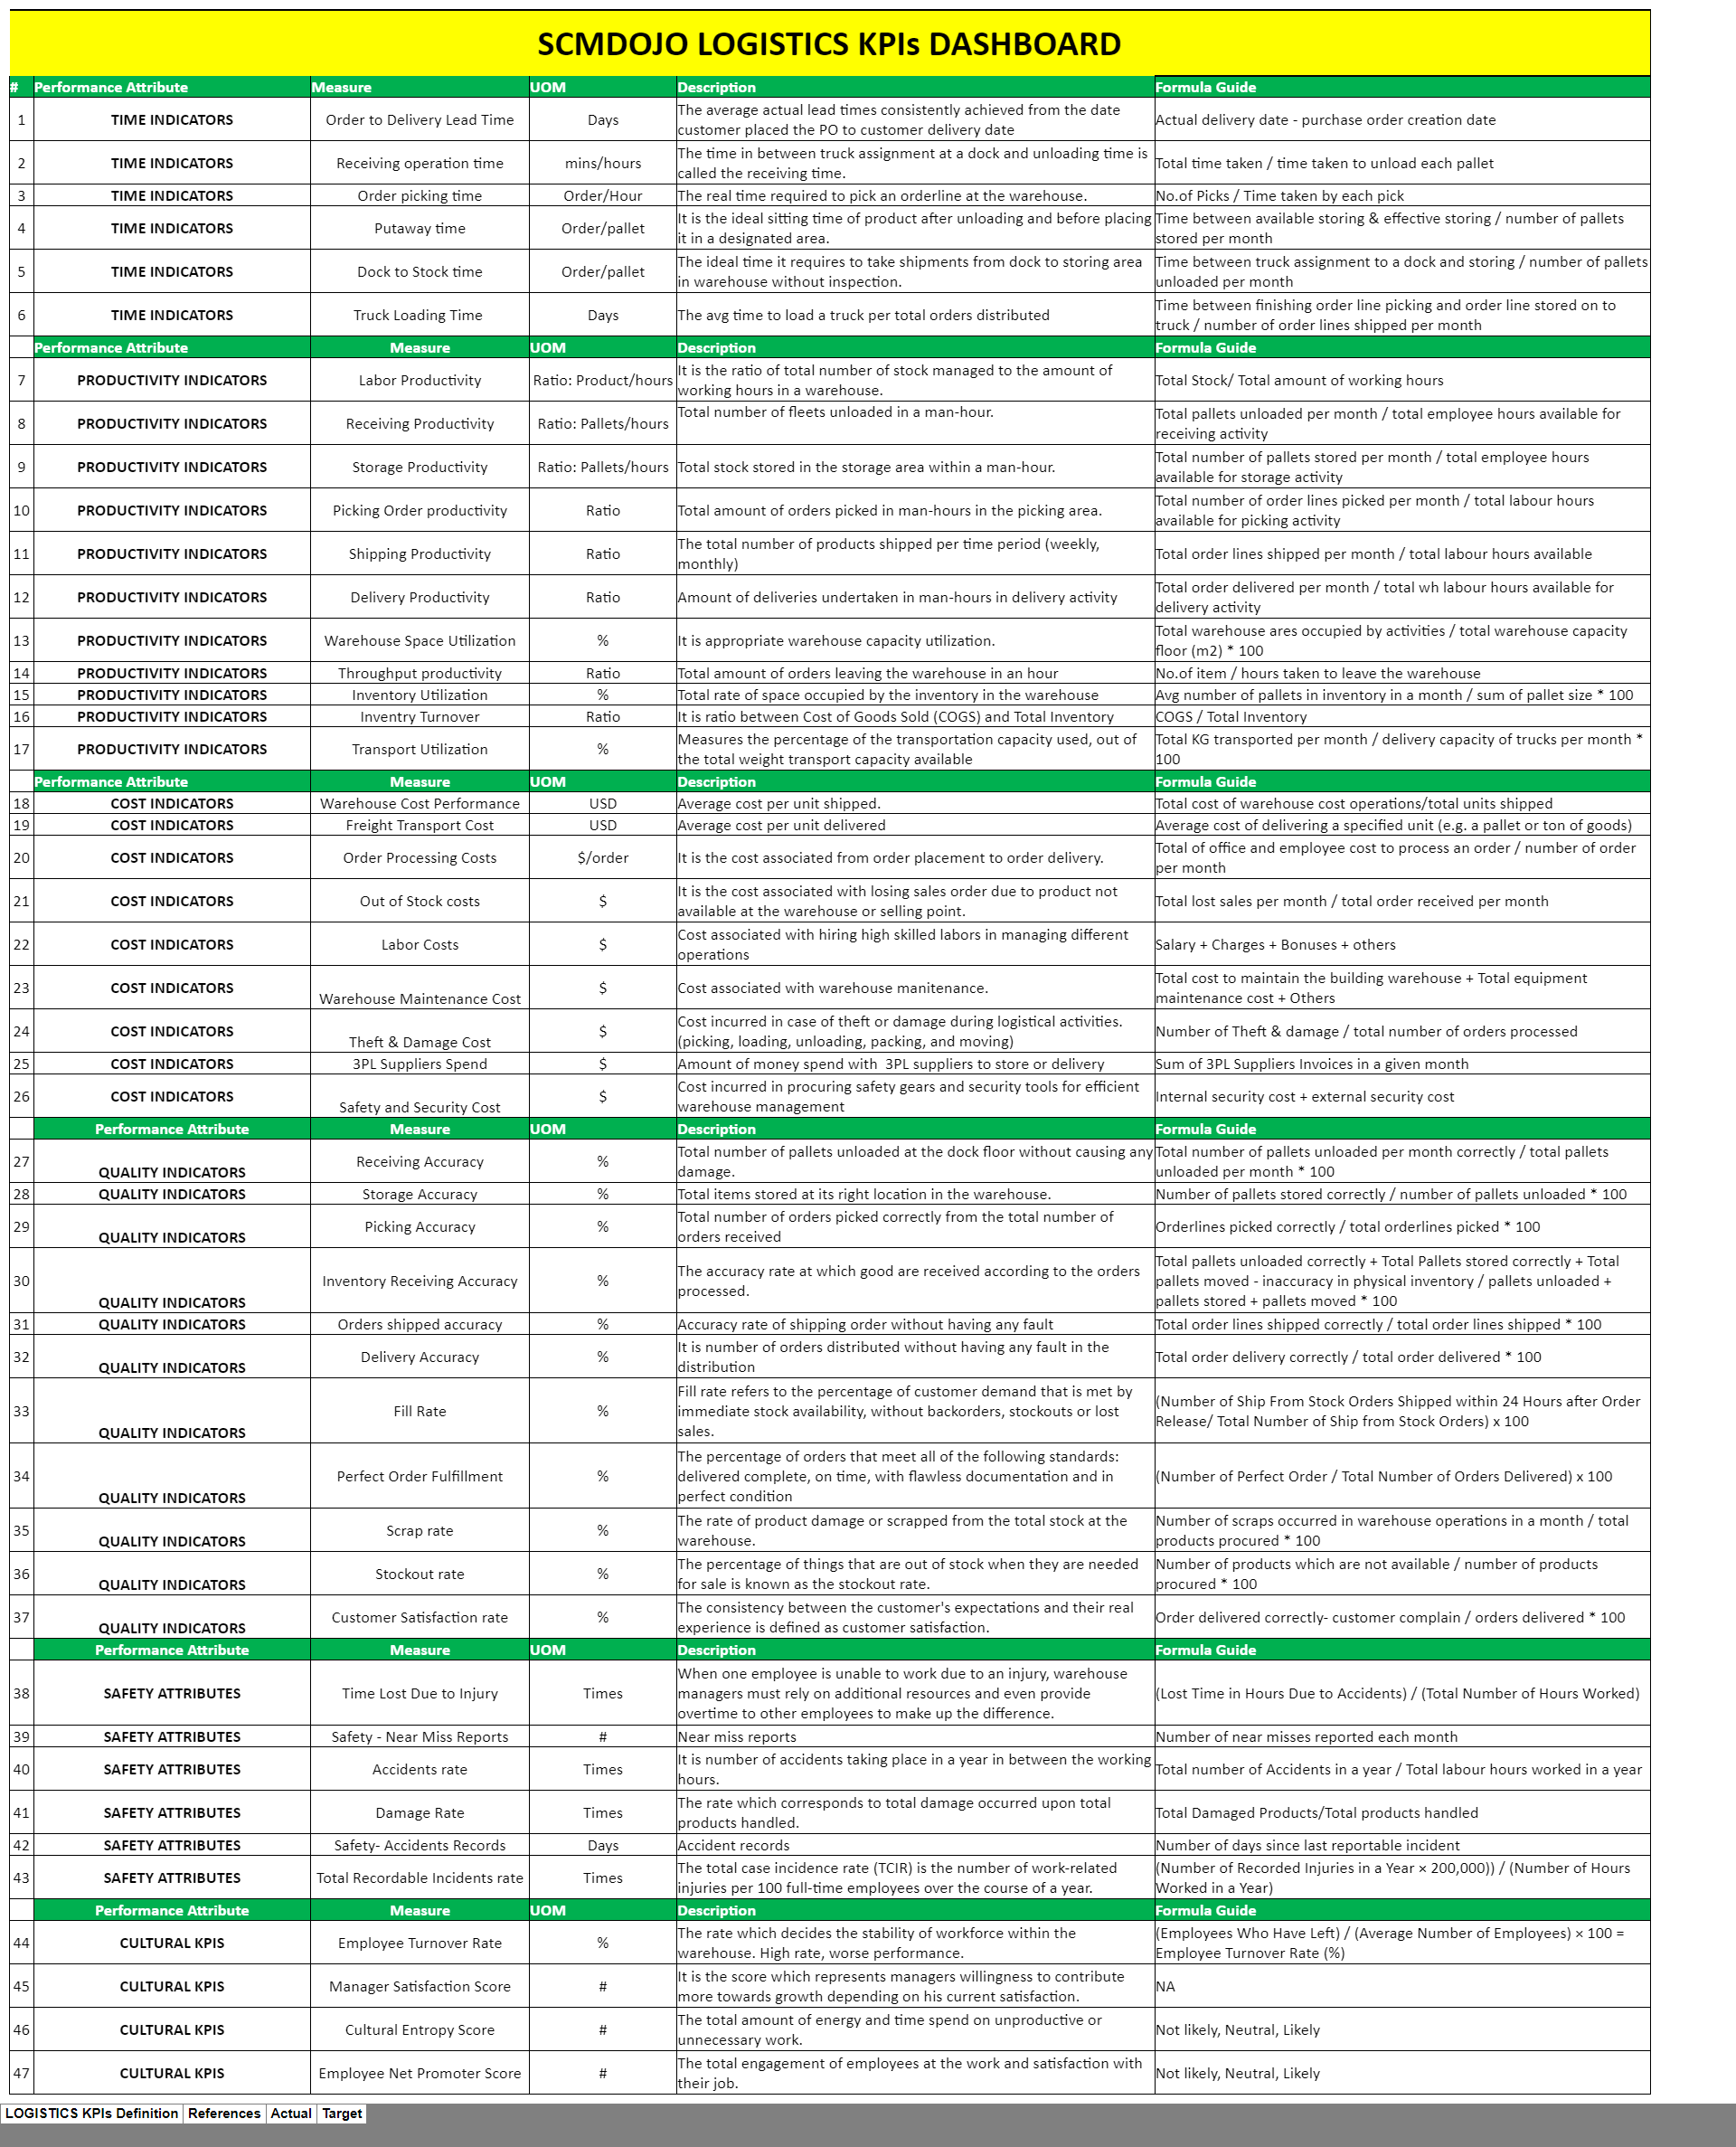 A complete view of the 47 recommended logistics KPIs included in the Logistics KPI Dashboard Excel Template, covering transport, warehouse, cost, quality, and safety metrics.
Related Resources
- Supply Chain KPI Dashboard
- Procurement KPI Template
- Must-Know Metrics for Supply Chain Professionals (Course)
Logistics KPI Dashboard Demo and Tutorial
Watch how the Dashboard Excel Template works in action. This step-by-step tutorial will walk you through setting up the dashboard, inputting logistics data, and interpreting KPI results.
[embedyt]https://youtu.be/qYxwZ4jz0BM[/embedyt]Input
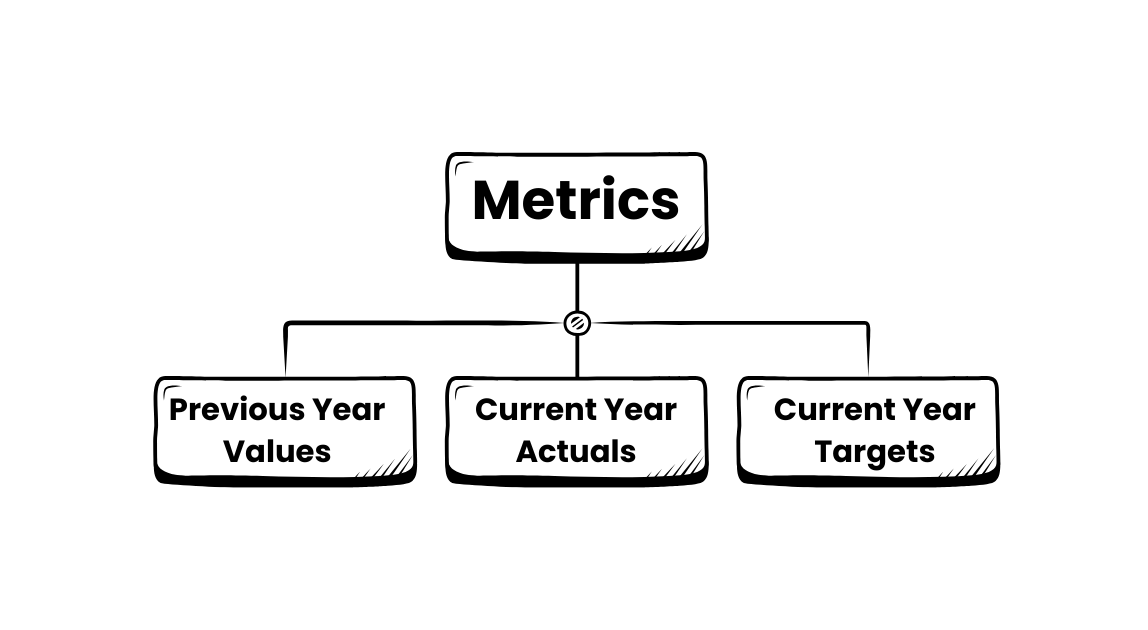 Input example from the Logistics KPI Dashboard Excel Template, where users enter previous year values, current year actuals, and target metrics.
Output
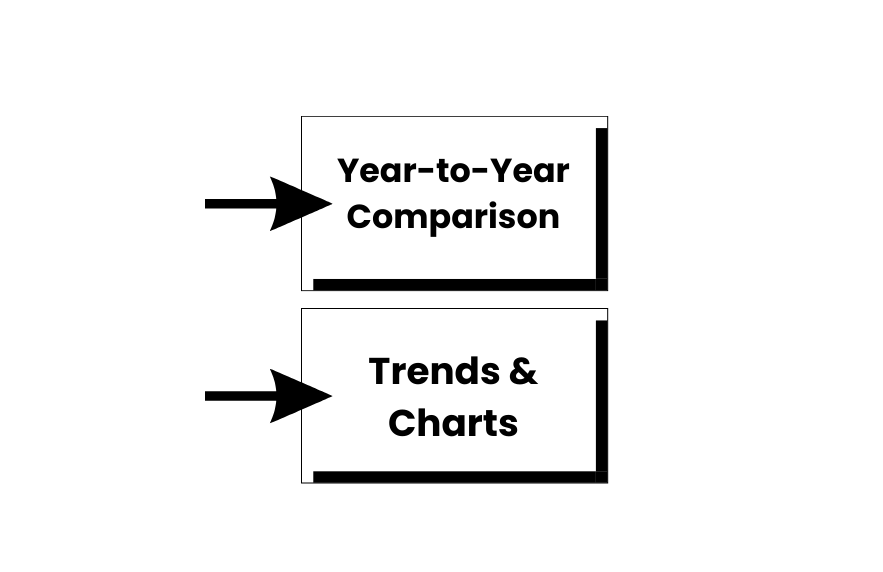 Graphic highlighting the two output views available in the Logistics KPI Dashboard: Year-to-Year Comparison and Trends & Charts.
A Snapshot of the Logistics KPI Dashboard in Excel


Download Your Ready-to-Use Excel Dashboard
-
Secure checkout via PayPal.
-
If PayPal isn’t available in your country, download via Gumroad.
👉 Get your copy today and start making smarter decisions with the Logistics KPI Dashboard.
Frequently Asked Questions (FAQs)
Q1: How does this Logistics KPI Dashboard improve performance?
A1: It provides clear KPI data to identify inefficiencies and optimize logistics operations.
Q2: Can I customize the dashboard?
A2: Yes, the template is fully customizable to your specific logistics and supply chain needs.
Q3: Is it suitable for both small and large businesses?
A3: Absolutely — it’s designed for companies of all sizes and industries.
Q4: What’s included in the purchase?
A4: You’ll receive the Excel template with 25 pre-loaded KPIs, plus the ability to add and customize additional KPIs.
Q5: How do I download the file after purchase?
A5: Once purchased, you’ll get instant access to download the dashboard for immediate use.

