Supply Chain KPI Dashboard Excel Template (2025)
Are you responsible for measuring key performance indicators (KPIs) in supply chain management? The Supply Chain KPI Dashboard Excel Template is your ready-to-use solution for tracking, analyzing, and improving performance. This powerful Excel dashboard is fully customizable, making it the ideal tool to monitor, measure, and control supply chain KPIs such as delivery reliability, inventory


 1 Files
 60 Purchases
 Unlimited access, anywhere, anytime
 Upgrade to Student or Pro plan to avail more discounts and perks
Files
- Supply Chain KPI Dashboard FileNaN undefined
Are you responsible for measuring key performance indicators (KPIs) in supply chain management? The Supply Chain KPI Dashboard Excel Template is your ready-to-use solution for tracking, analyzing, and improving performance.
This powerful Excel dashboard is fully customizable, making it the ideal tool to monitor, measure, and control supply chain KPIs such as delivery reliability, inventory turnover, and cost efficiency.
According to Handfield et al. (2009), dashboards like this bring measurable benefits:
-
Systematic measurement improves performance.
-
Better communication across the supply chain.
-
Early identification of improvement opportunities.
-
Feedback loops that drive alignment.
-
Motivation through visible, trackable results.
The supply chain KPI dashboard helps you maintain SMART targets (Specific, Measurable, Attainable, Realistic, and Timely), enabling continuous improvement across logistics, procurement, and operations.
“If you cannot measure it, you cannot improve it.” – Lord Kelvin
Key Benefits of the Supply Chain KPI Dashboard Excel Template
-
Streamlined Monitoring: Track supply chain KPIs in one centralized dashboard.
-
Instant Insights: Real-time visibility into key performance metrics.
-
Easy Customization: Adjust KPIs to match your business goals.
-
Time Efficiency: Save 6–8 days of manual reporting.
-
Industry Best Practice: Built on widely used supply chain KPI standards.
-
Data-Driven Decision Making: Act quickly with accurate, up-to-date data.
-
Competitive Advantage: Demonstrate operational excellence.
-
Adaptability: Flexible dashboard that evolves with your business.
Top Supply Chain KPIs to Track in 2025
Based on 16+ years of experience, we recommend 18 core supply chain KPIs, grouped under performance attributes such as:
-
Inventory Management KPIs (inventory turnover, stock accuracy).
-
Logistics KPIs (on-time delivery, transportation costs).
-
Supplier KPIs (quality defect rates, supplier lead time).
-
Financial KPIs (supply chain cost as % of sales).
-
Customer KPIs (perfect order rate, order accuracy).
This supply chain KPI dashboard Excel template gives you a clear, visual overview of these KPIs in one place.
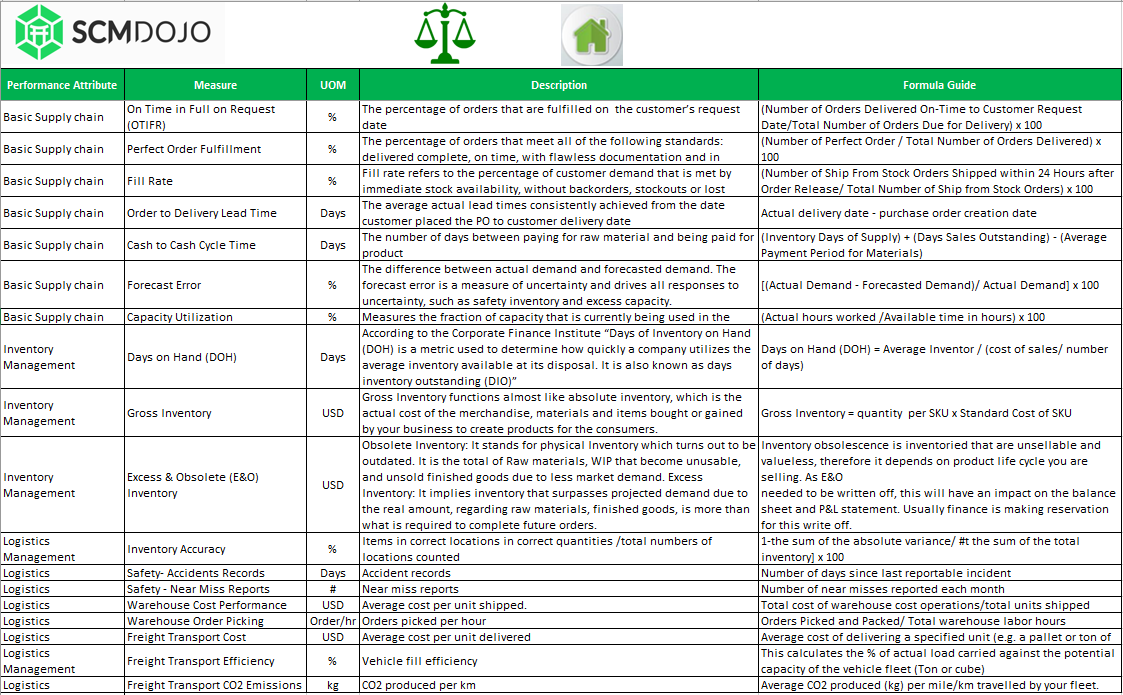
Metrics for supply chain performance
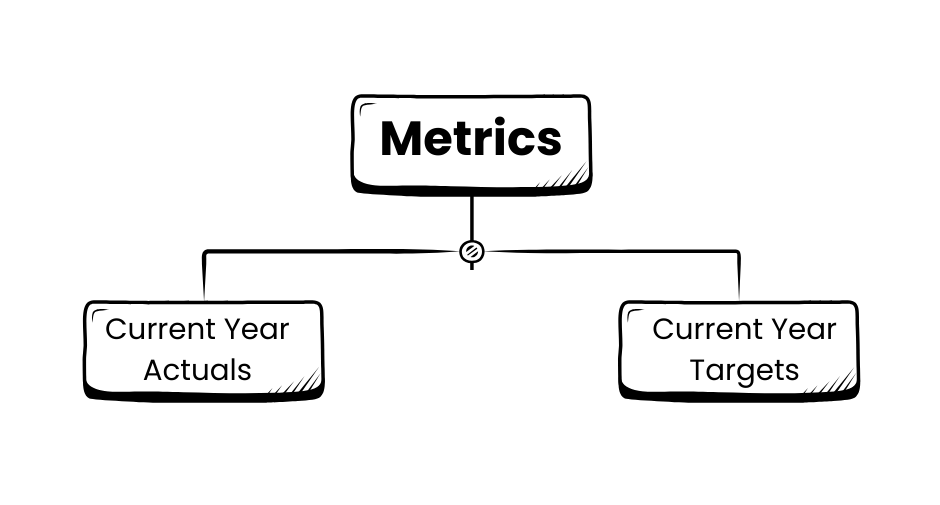
Create Your Own Supply Chain KPI Dashboard in Excel
After identifying additional KPIs in the Actuals sheet, you can set performance targets in the Target sheet. This makes it easy to compare year-over-year values and future goals.
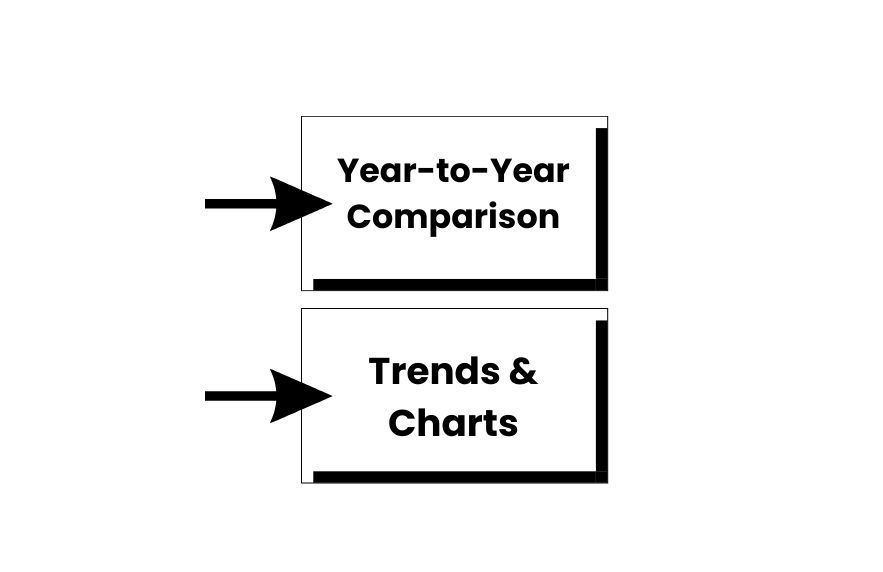
The dashboard also provides clear visualizations, summarizing:
-
Inventory reports
-
Safety and compliance KPIs
-
Warehouse performance
-
Freight and transport costs
-
Overall supply chain performance
Input
Output
 Want to maximize the value of this dashboard? Enroll in our "Must-Know Metrics for Supply Chain Professionals" course, taught by SCMDOJO Expert Paul Denneman. This training dives deeper into supply chain performance management, helping you interpret KPIs and drive measurable improvements across your operations.
Key Features of the Excel Template for Supply Chain KPIs
-
30-day and cumulative analysis included
-
Year-over-year and target comparison
-
Interactive KPI chart summary
-
User-friendly Excel design with clear outputs
-
Templates for inventory, logistics, finance, and suppliers
-
Works on Windows & Mac, Excel 2007+
-
Instant download, no installation required
-
Print-friendly reporting format
Frequently Asked Questions (FAQs)
Q1: What is a Supply Chain KPI Dashboard?
A supply chain KPI dashboard is an Excel-based tool that tracks key metrics like on-time delivery, order accuracy, and cost efficiency to monitor and optimize supply chain performance.
Q2: What are the 5 most important supply chain KPIs?
On-time delivery, inventory turnover, order fulfillment cycle time, cost of goods sold (COGS), and order accuracy.
Q3: How is this template different from other dashboards?
It is pre-built with industry best practices, customizable, and saves 6–8 days of reporting each month.
Q4: Can I customize the Supply Chain KPI Dashboard?
Yes, it’s fully customizable. You can add or edit KPIs to match your organization’s unique needs.
Q5: Who should use this dashboard?
It is designed for supply chain managers, procurement teams, logistics leaders, and analysts who need data-driven insights.
References
-
Brewer, P. C., & Speh, T. W. (2000). Using the balanced scorecard to measure supply chain performance. Journal of Business Logistics, 21(1), 75. Read summary here
-
Handfield, R., Monczka, R., Giunipero, L., & Patterson, J. (2009). Purchasing and Supply Chain Management. Cengage Learning
-
Chartered Institute of Procurement & Supply (CIPS): Supply Chain Performance Resources
-
Dilbert. (1996). Performance Measurement. Dilbert Comic Strip

